Overview
About the Project
Graphite is an enterprise-ready monitoring tool that runs equally well on cheap hardware or Cloud infrastructure. Teams use Graphite to track the performance of their websites, applications, business services, and networked servers. It marked the start of a new generation of monitoring tools, making it easier than ever to store, retrieve, share, and visualize time-series data.
Graphite was originally designed and written by Chris Davis at Orbitz in 2006 as side project that ultimately grew to be their foundational monitoring tool. In 2008, Orbitz allowed Graphite to be released under the open source Apache 2.0 license. Numerous large companies have deployed Graphite to production where it helps them to monitor their production e-commerce services and plan for growth.
What Graphite is and is not.
Graphite does two things:
Store numeric time-series data
Render graphs of this data on demand
Graphite is not a collection agent, but it offers the simplest path for getting your measurements into a time-series database. Feeding your metrics into Graphite couldn't be any easier.
$ echo "foo.bar 1 `date +%s`" | nc localhost 2003
Need a collection agent or language bindings? Graphite has one of the largest ecosystems of data integrations and third-party tools.
Read the Full DocumentationThe Architecture in a Nutshell
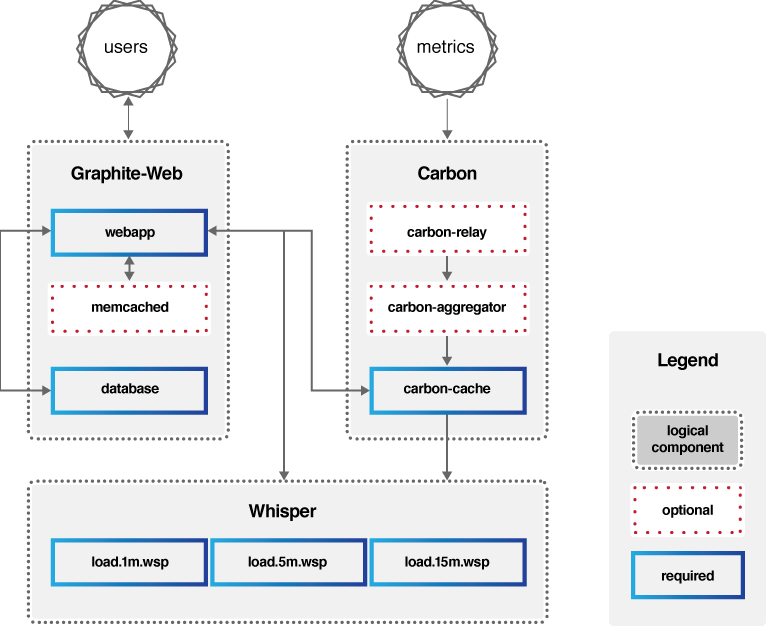
Graphite consists of three software components:
carbon - a high-performance service that listens for time-series data
whisper - a simple database library for storing time-series data
graphite-web - Graphite's user interface & API for rendering graphs and dashboards
Metrics get fed into the stack via the Carbon service, which writes the data out to Whisper databases for long-term storage. Users interact with the Graphite web UI or API, which in turn queries Carbon and Whisper for the data needed to construct the requested graphs.
Graphite's web platform offers a variety of output styles and formats, including raw images, CSV, XML, and JSON, allowing anyone to easily embed custom graphs in other web pages or dashboards.


