How can I view my Graphite metrics?
If getting metrics into Graphite is a walk in the park, then getting them out is like taking candy from a baby, on a swing, in that same park. Although the Graphite render API is a great way to retrieve graphs or metrics, and the Grafana project is undoubtedly first-in-class for Graphite user interfaces, diving into the Graphite Composer is usually the quickest way to introduce yourself to Graphite's visualization capabilities.
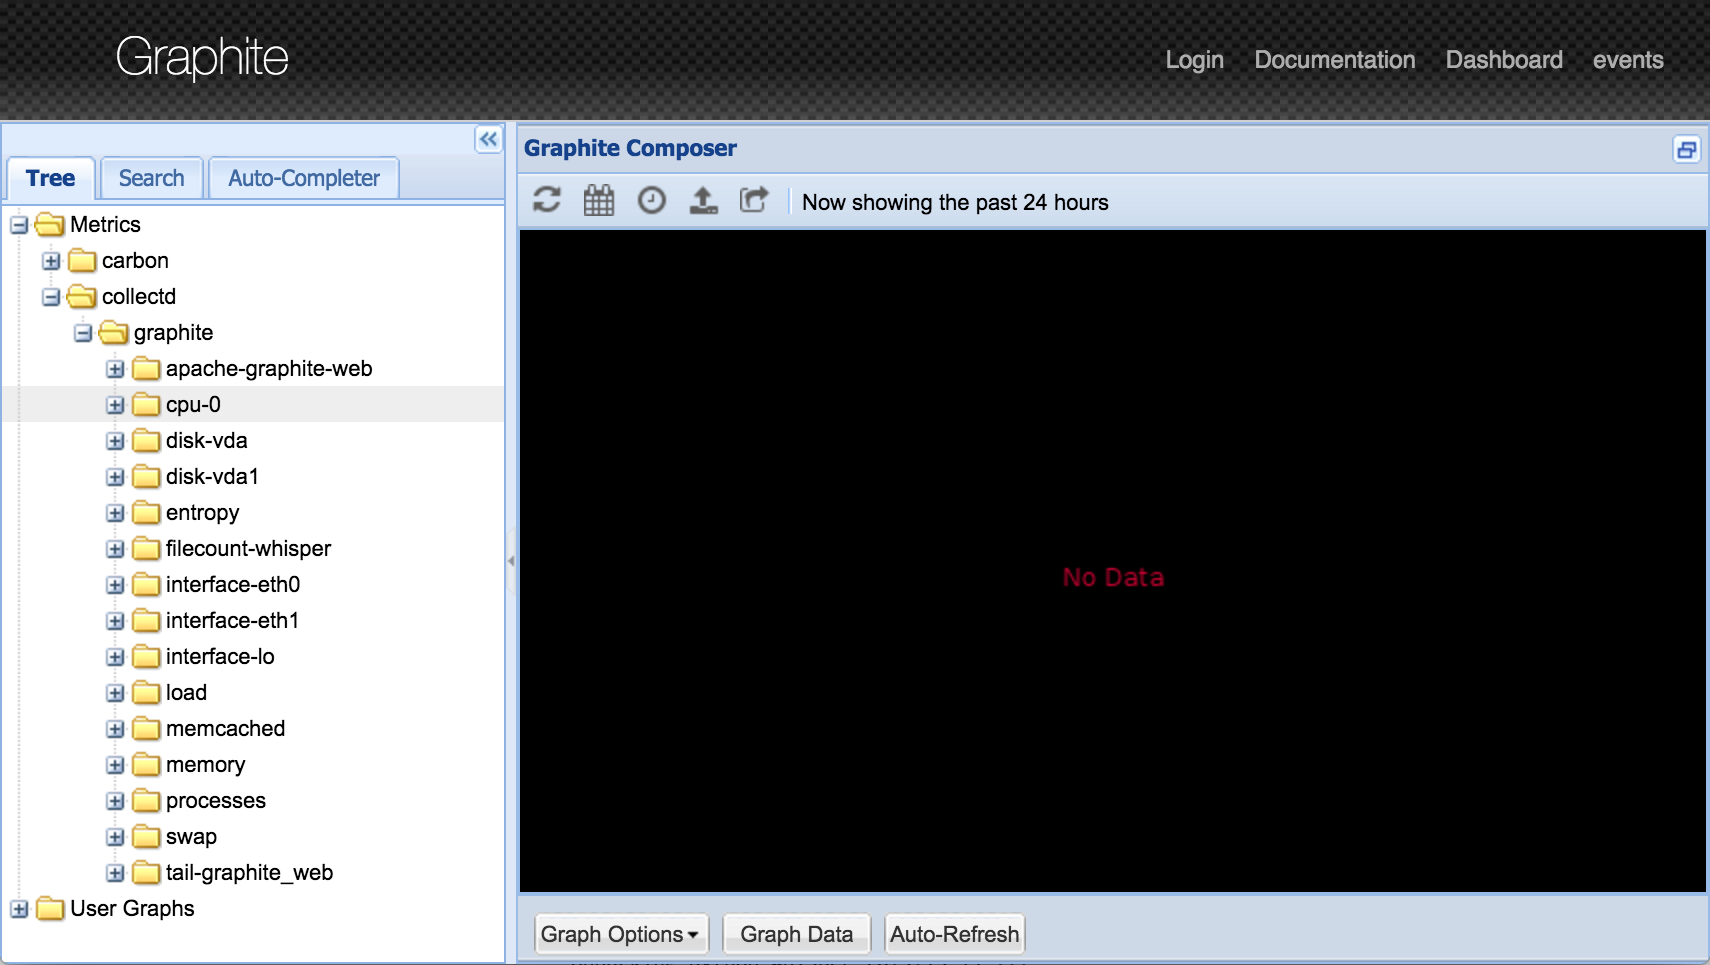
The Composer Window
The main Composer window includes a blank graph which acts as a canvas for your metrics. On the left, you'll find a navigation tree containing all of your metrics (and saved graphs) in a heirarchy mapping to their dot-delimited namespace.
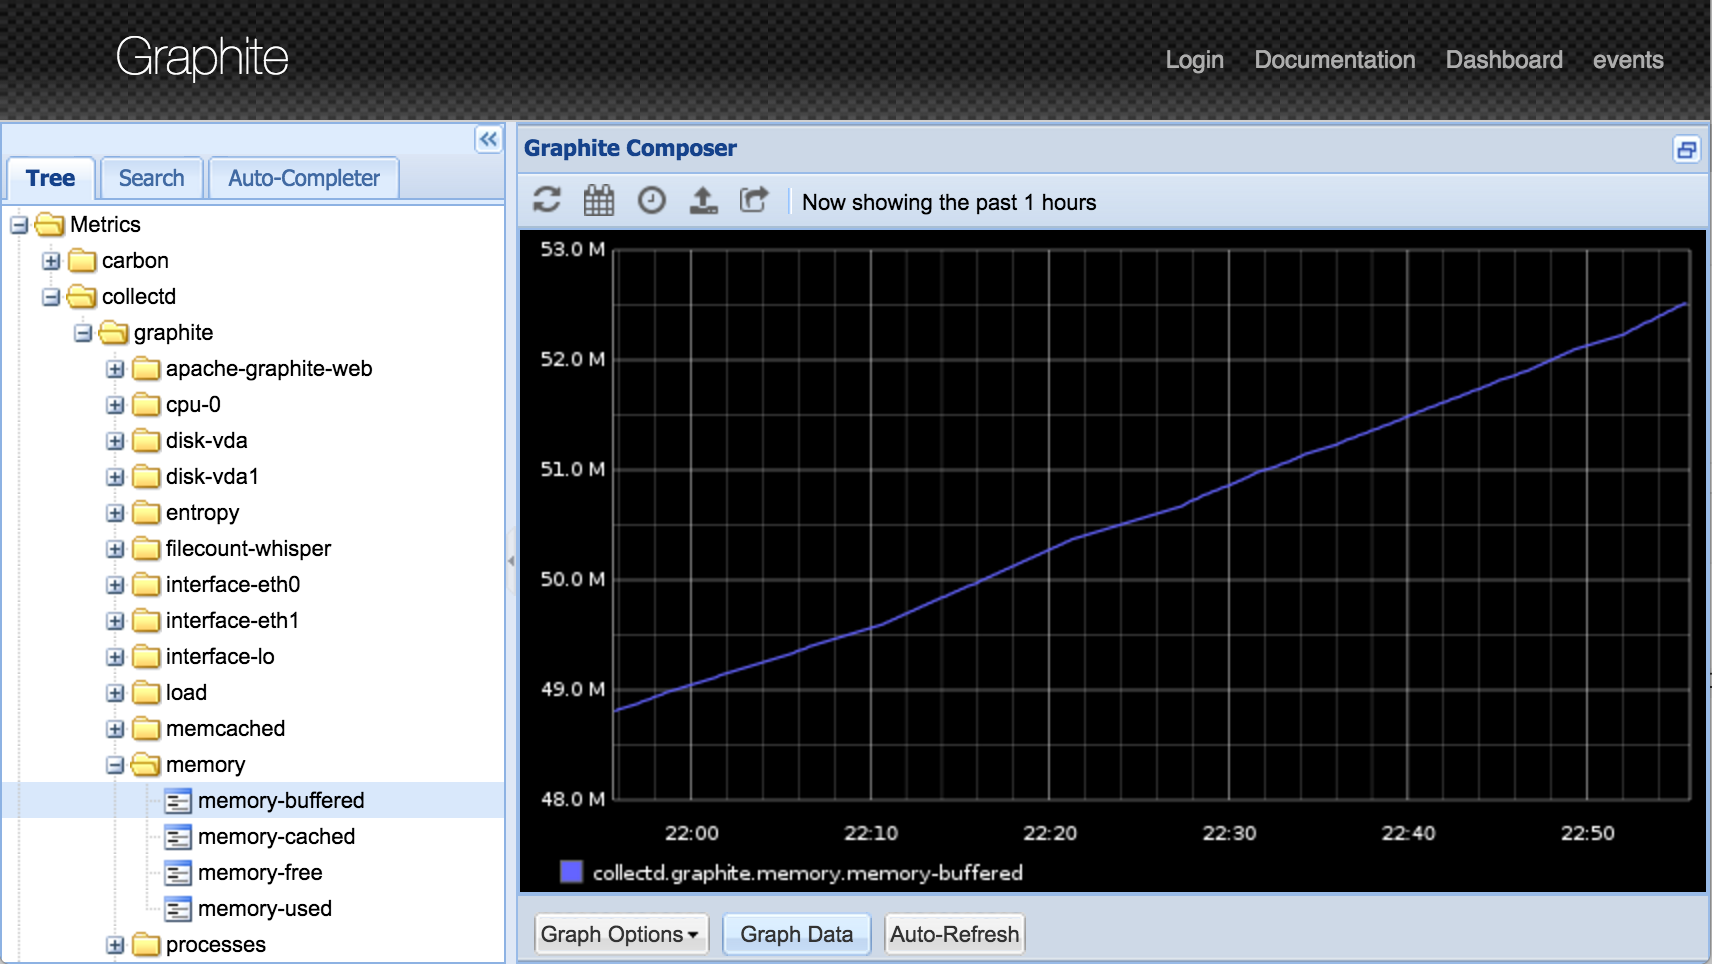
Adding metrics to a graph
Clicking on a metric will add (or remove) it to the graph. Here we can see the collectd.graphite.memory.memory-buffered metric rendered as a line chart and a legend added to the bottom of the graph. The y-axis tracks the values recorded, and the x-axis displays the time range.
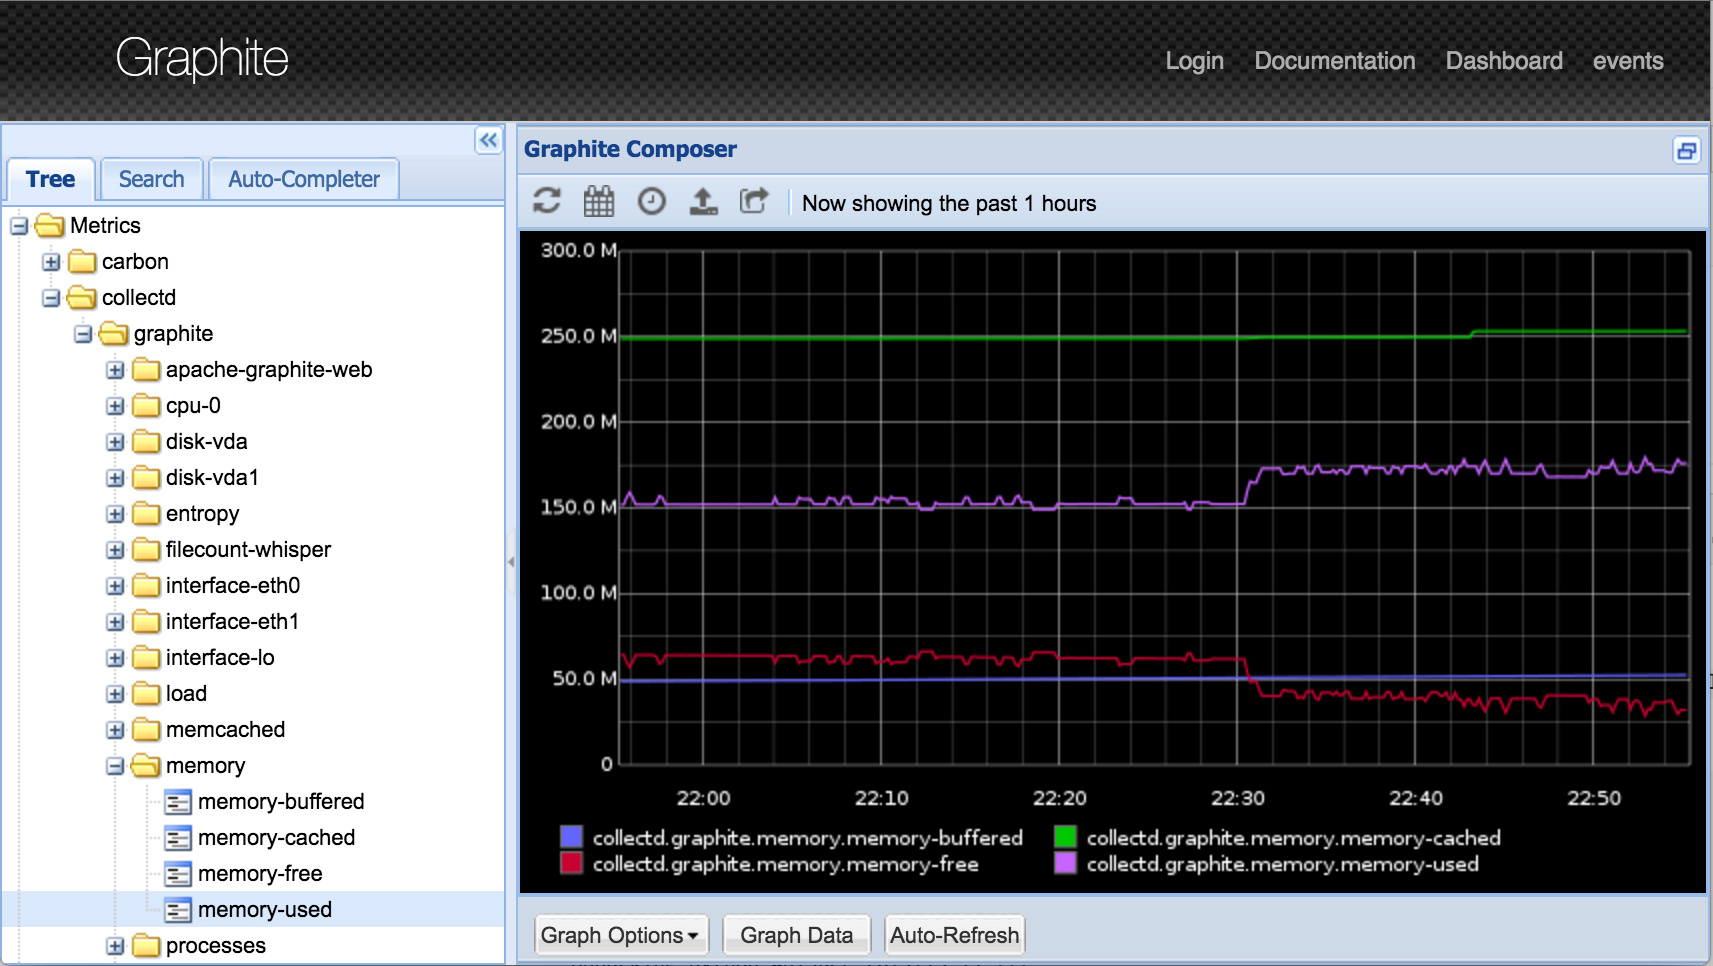
Selecting the other memory metrics will add them to the graph too. This is a great way to correlate different metrics at the same time.
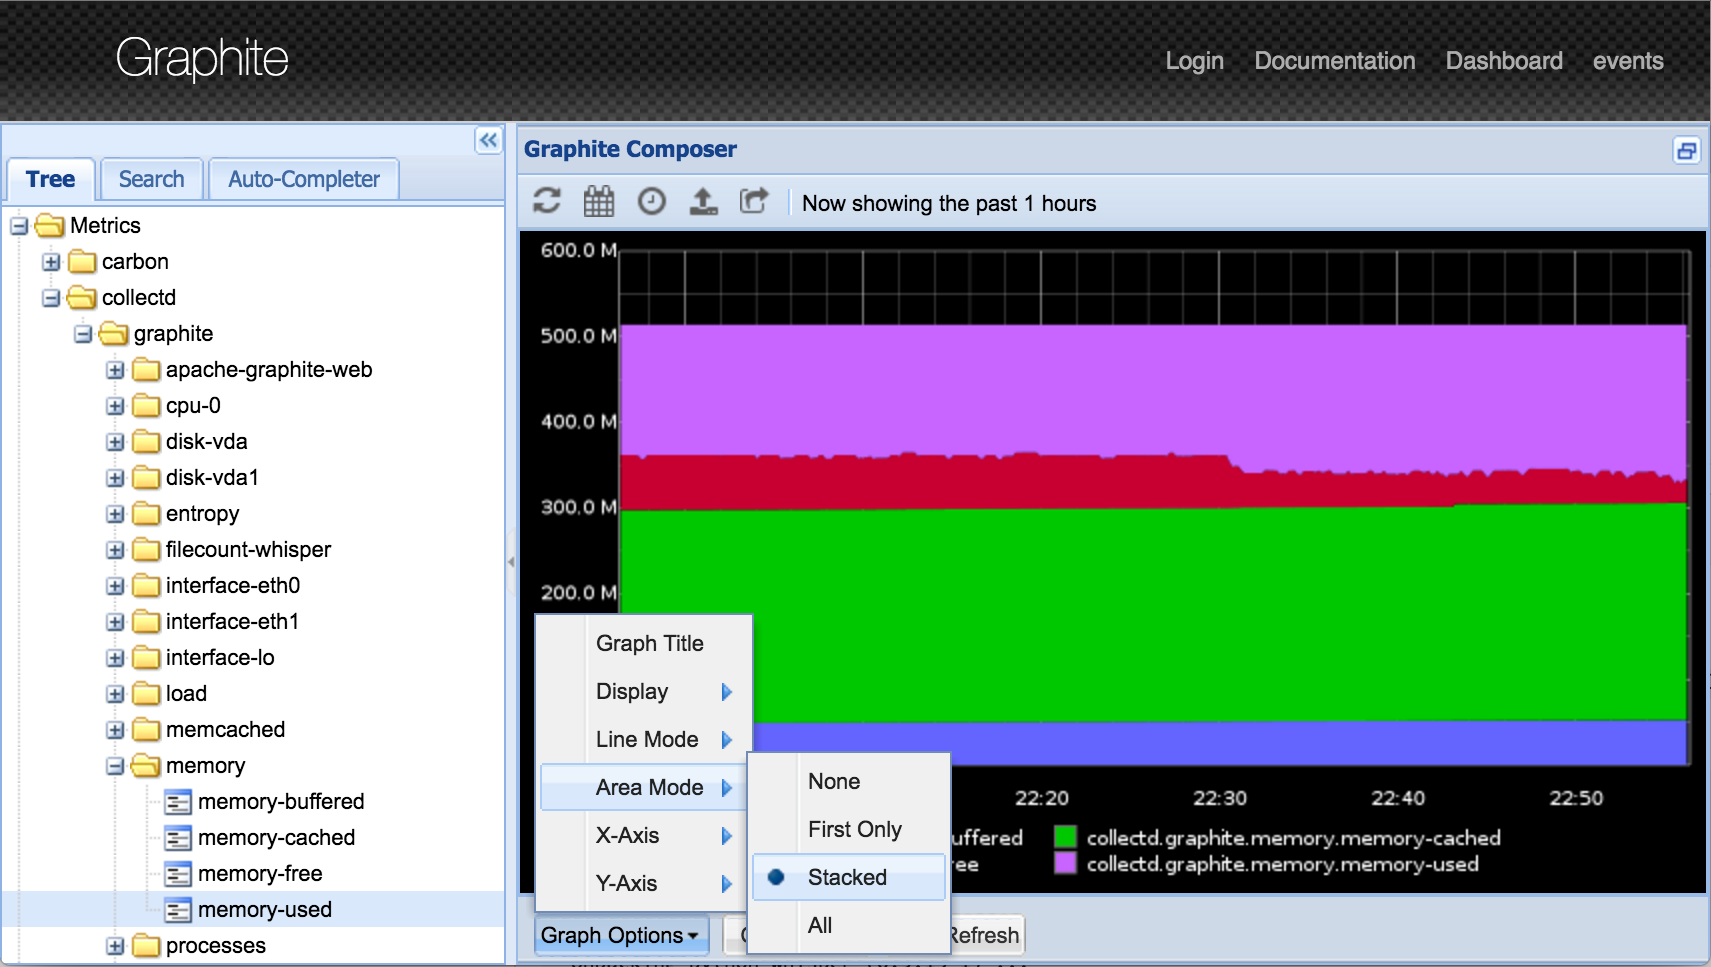
Stacked graphs
But what if we wanted to see the total memory footprint for this graph? Fortunately, Graphite has support for stacked charts. Enabling the Stacked option under the Area Mode graph options menu will cause all of our metrics to stack upon each other in the same graph.
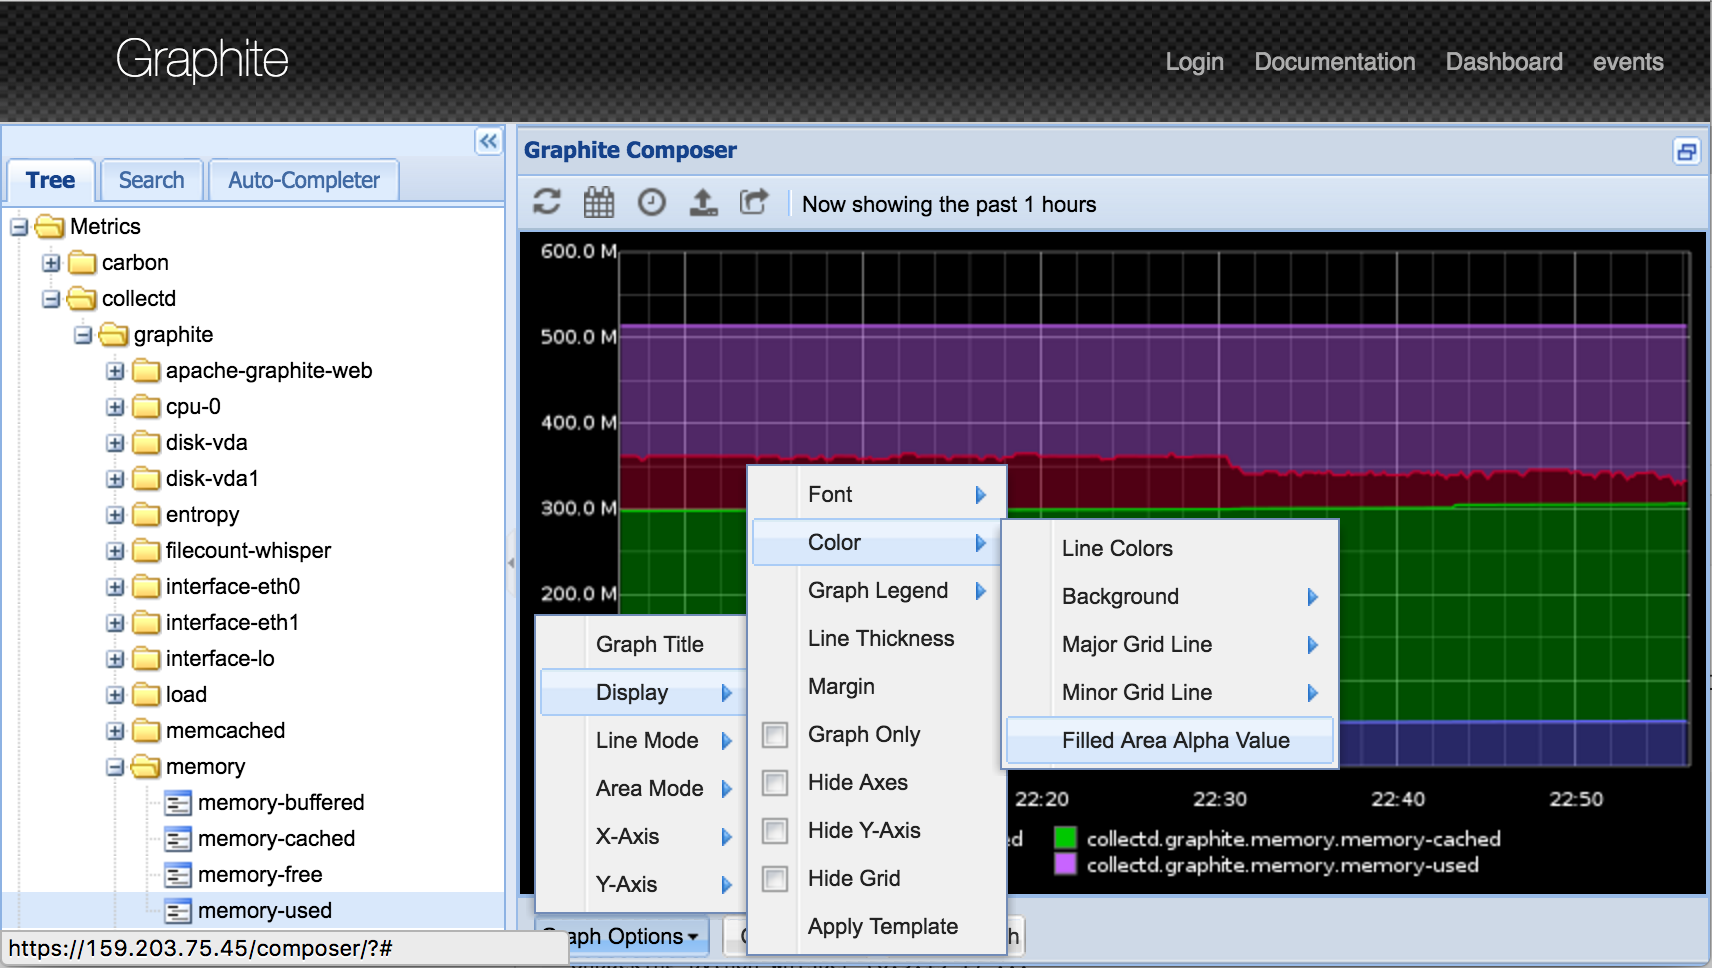
Area graph transparency
Awesome. Although admittedly it could stand for a bit less psychedelicity (if that's not a word, it totally should be). Let's increase the transparency by adjusting the graph Filled Area Alpha Value. In this example I've lowered it to 0.4 (1.0 is considered fully opaque).
Down the rabbit hole
This is a very shallow first look at some of Graphite's graphing and output capabilities. If you haven't already, you should definitely check out more of the render API's capabilities and Graphite's huge library of transformative and statistical functions.
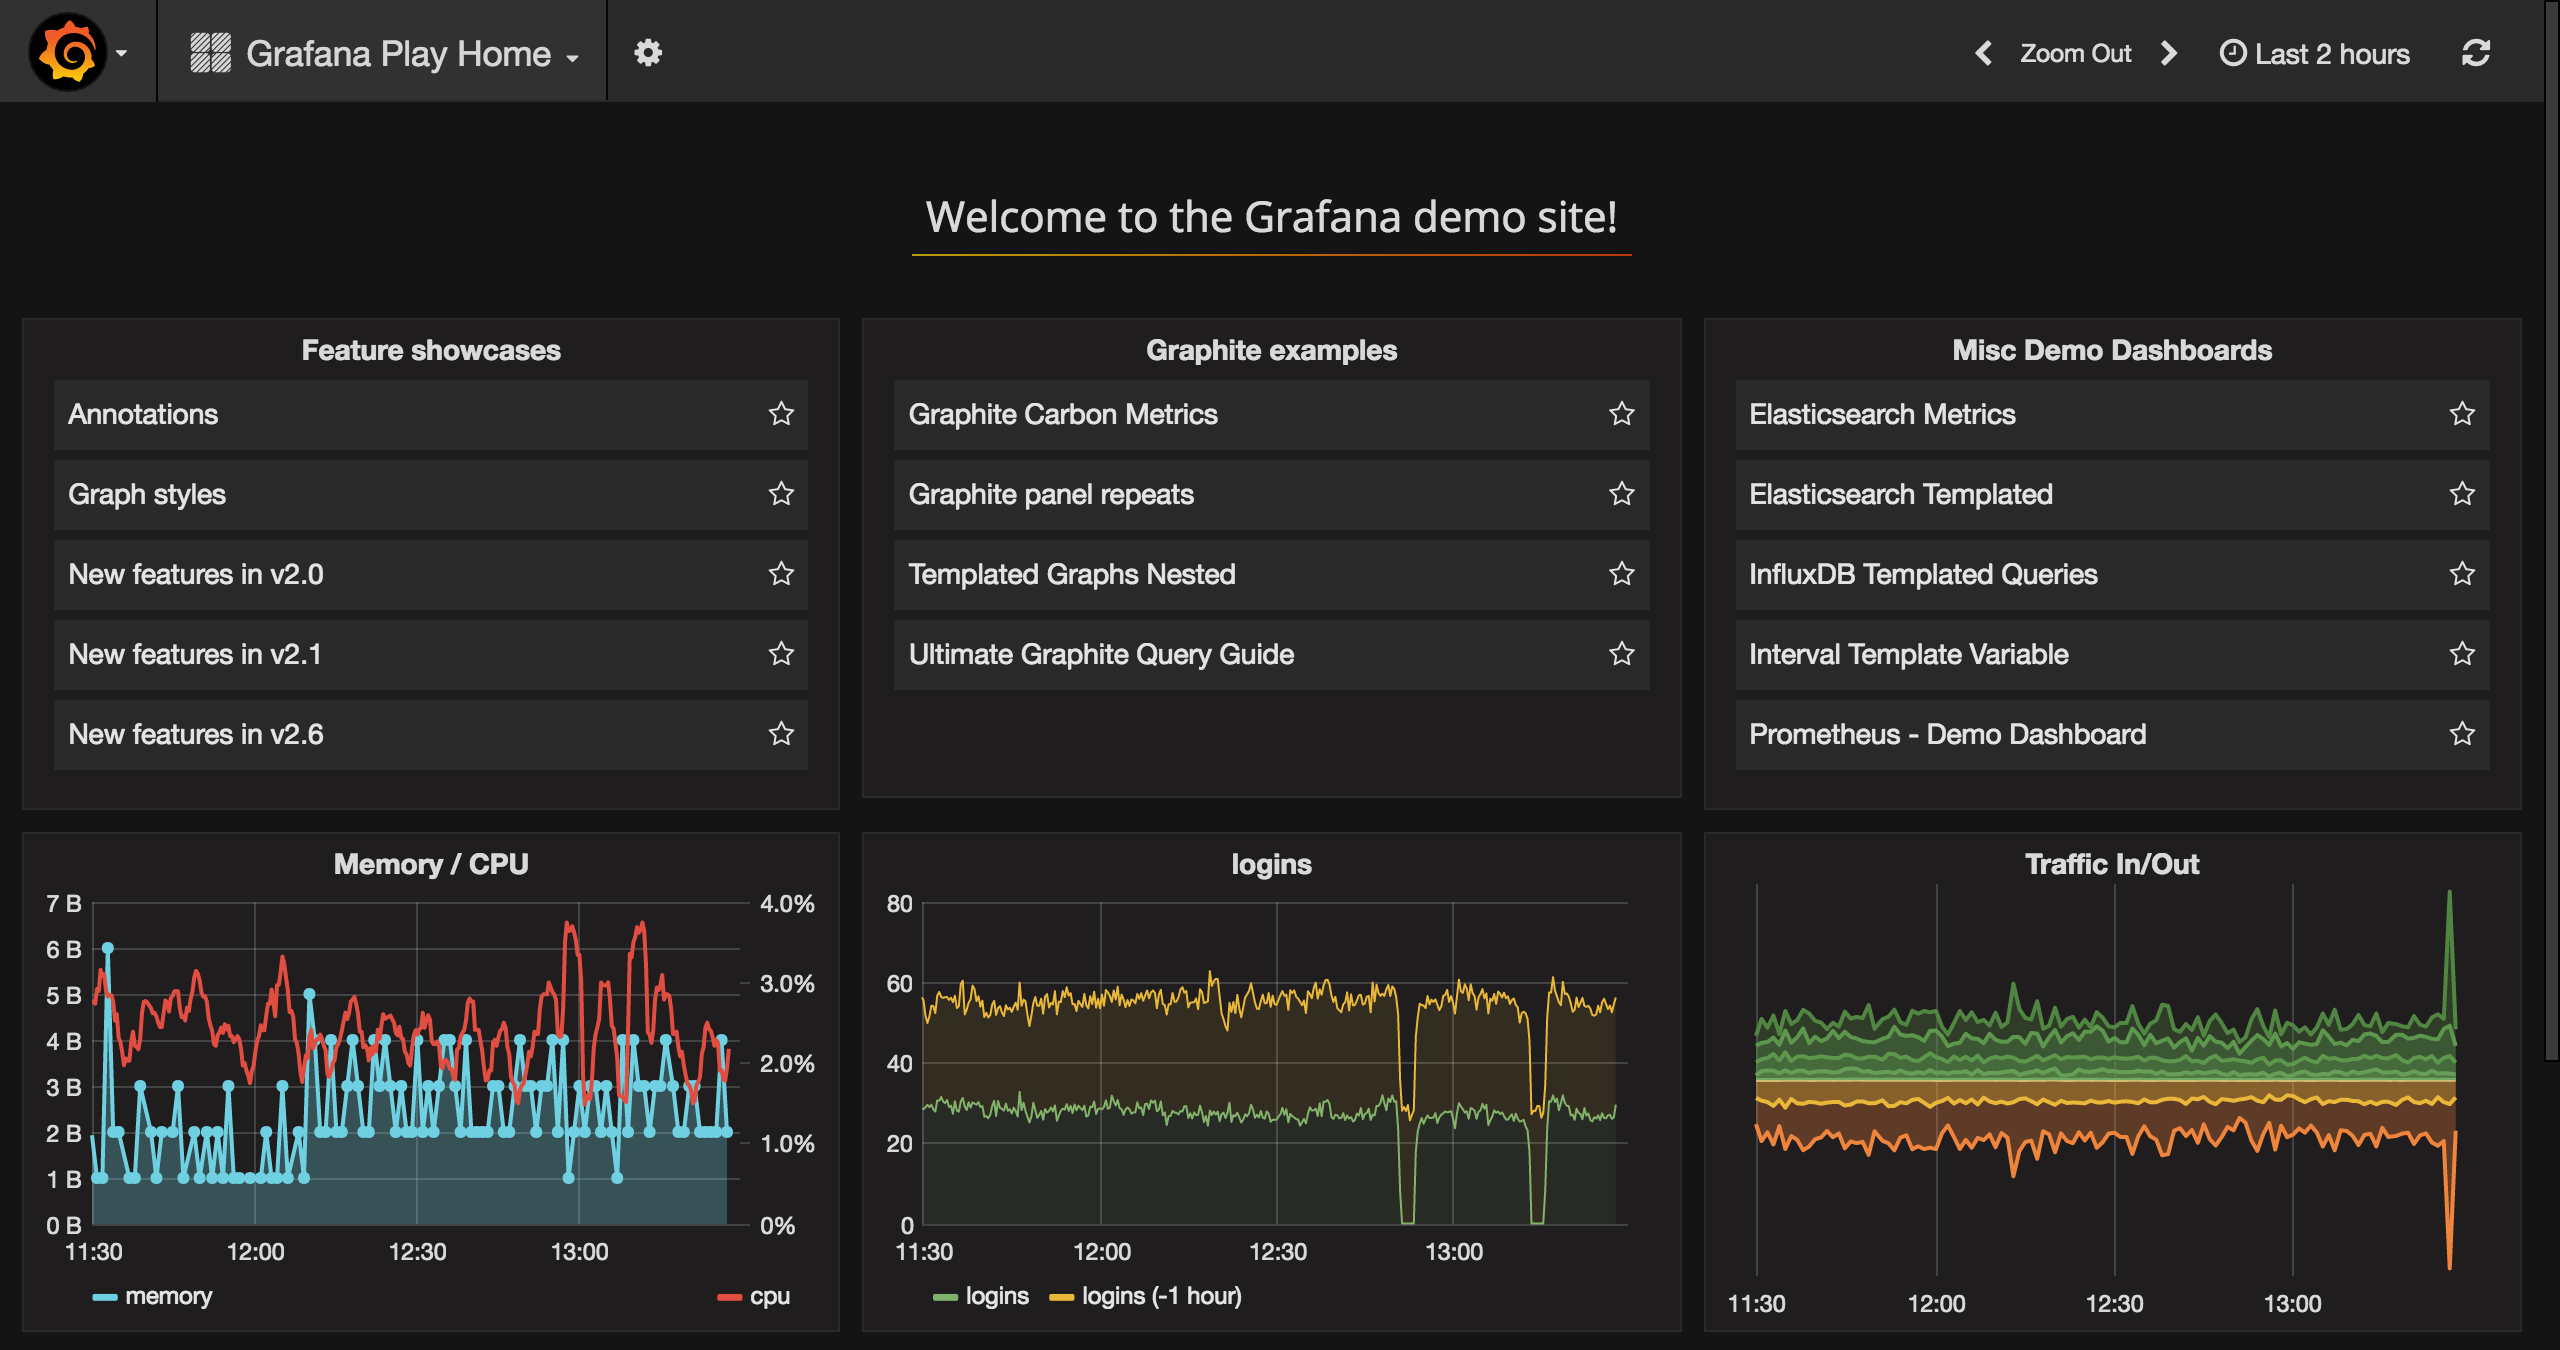
If you'd like to try out a more modern UI for Graphite, the Grafana project offers their own interactive sandbox. This is another great way to interact with your Graphite data and it offers many more visualization types than the native Composer.